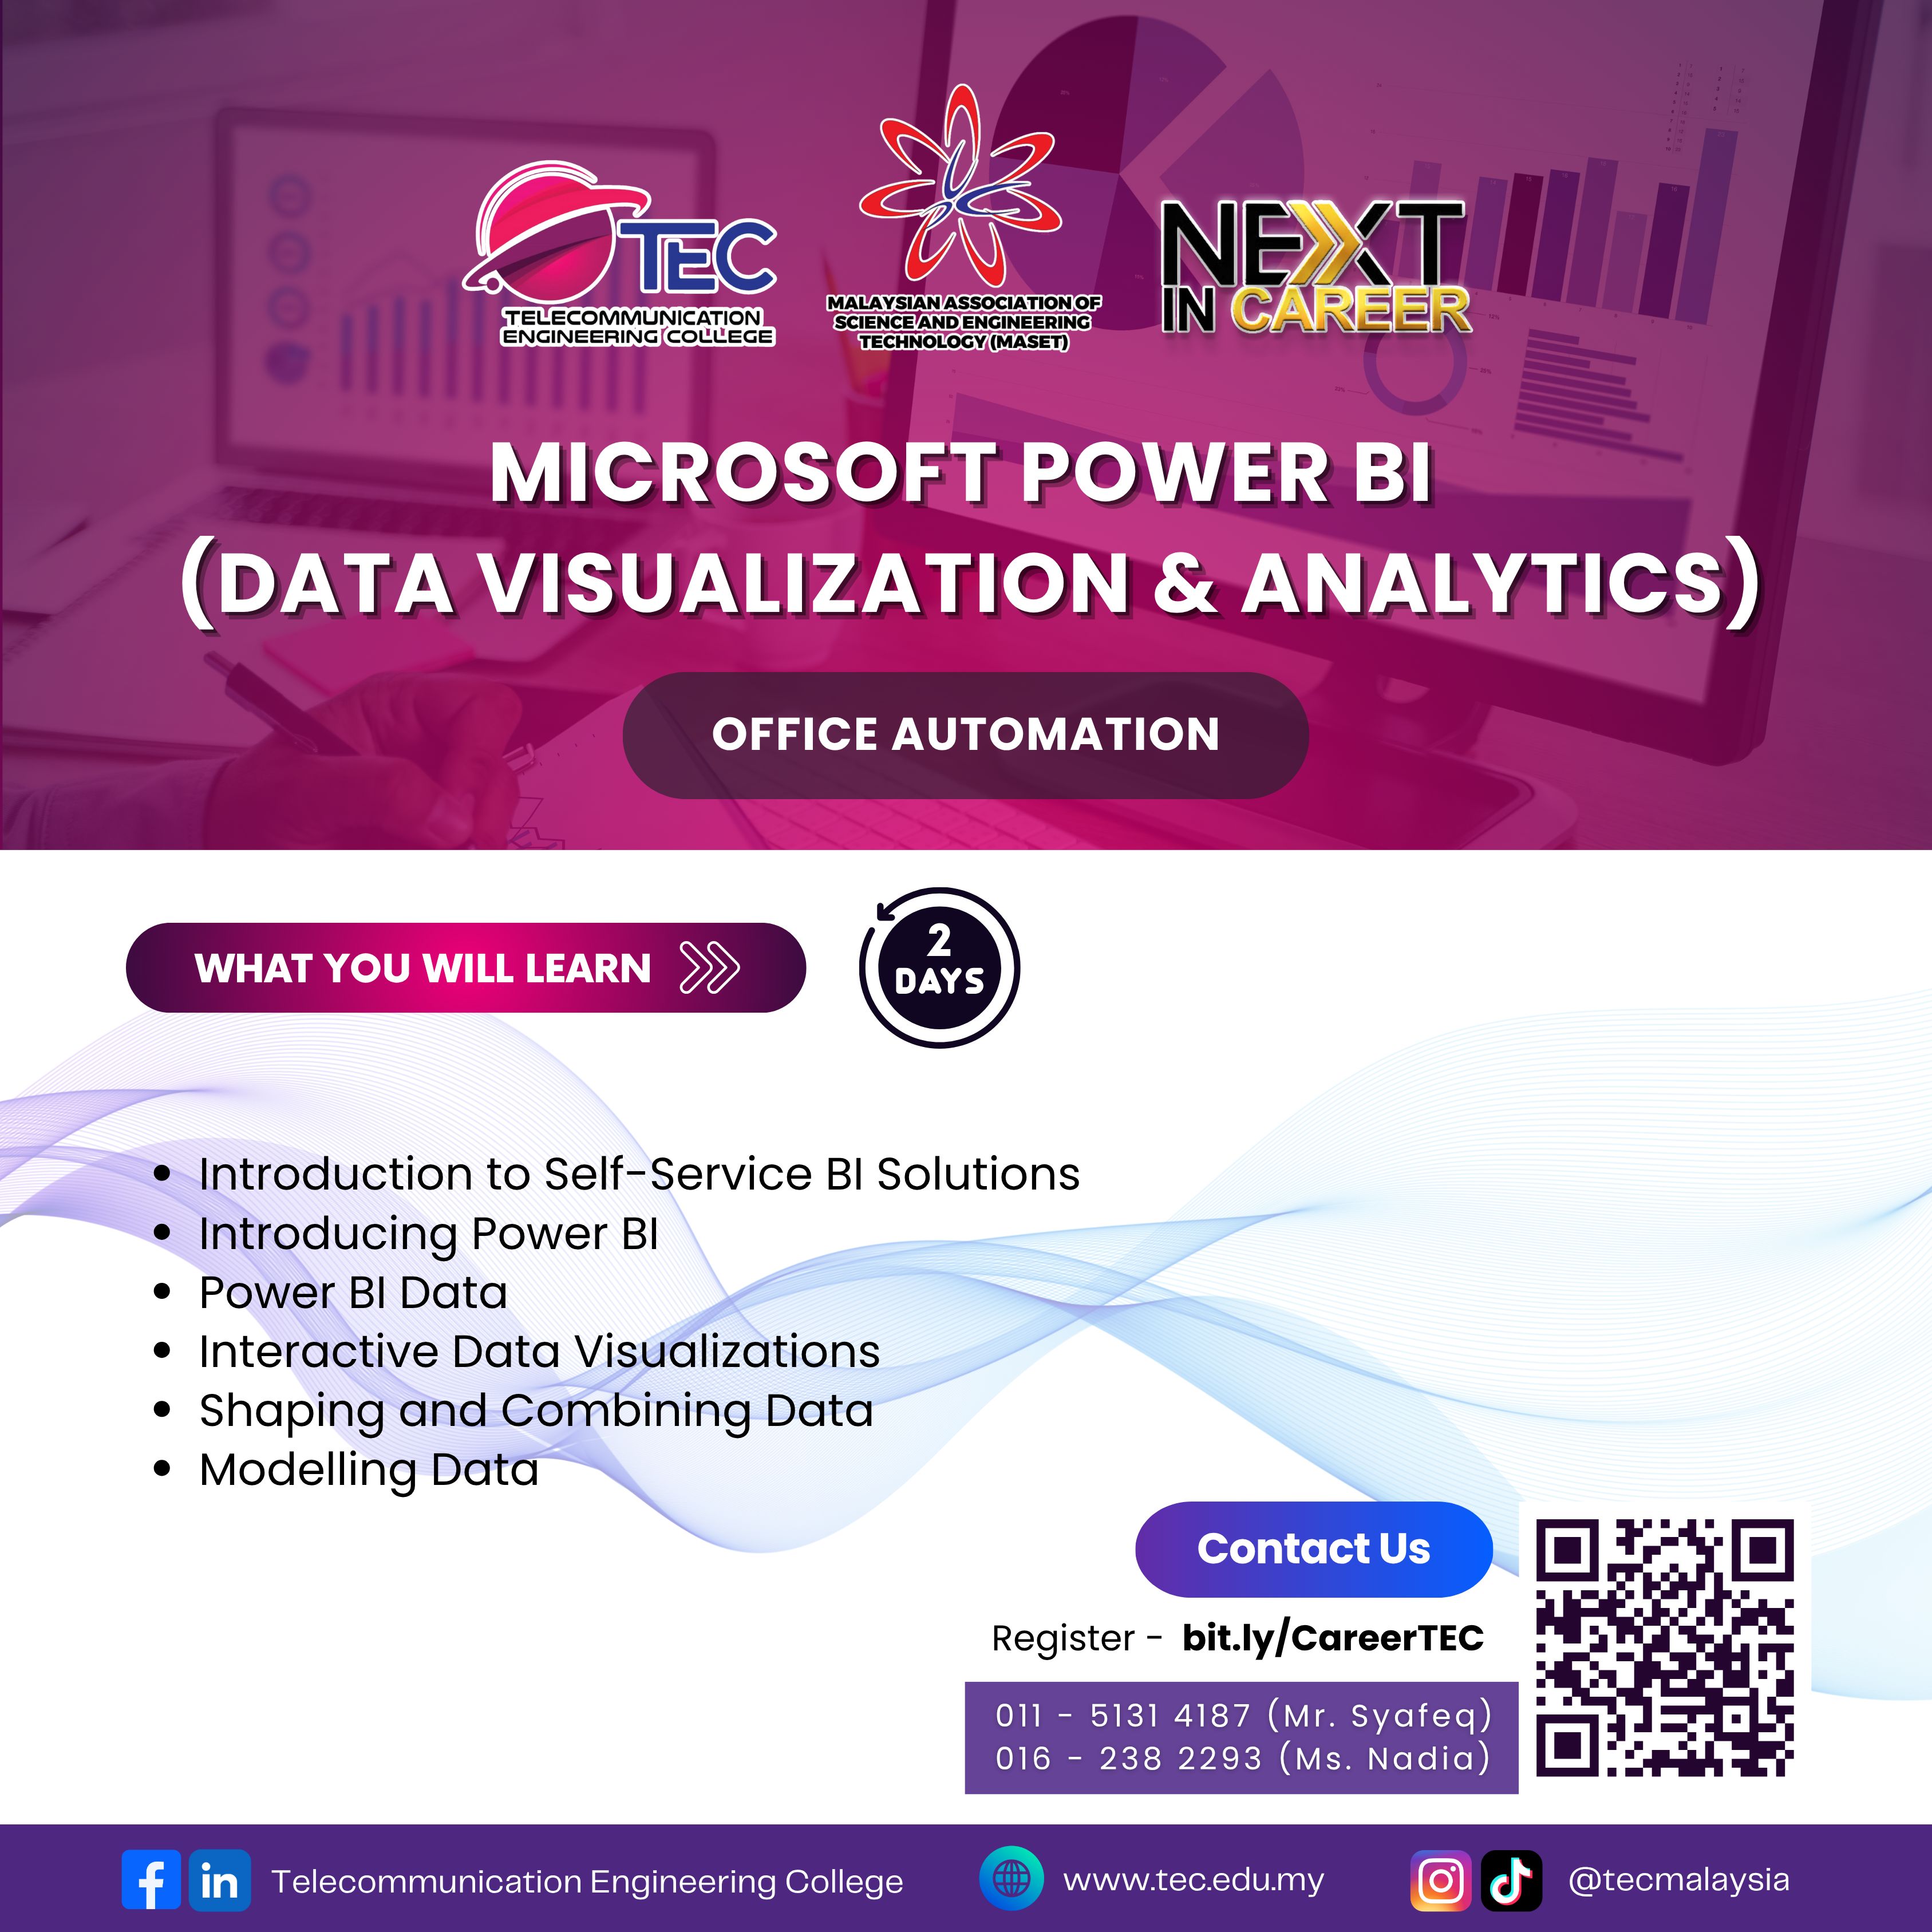
This course is designed to introduce participants to Microsoft Power BI as a powerful self-service business intelligence (BI) and data visualization tool. Participants will learn how to connect, shape, and model data from multiple sources and build interactive, insightful dashboards to support data-driven decision-making in any industry.

Learning Outcomes

By the end of this course, participants will be able to :

  • Understand the fundamentals of Self-Service BI and its advantages in a business context.
  • Navigate and use Power BI Desktop to build reports and dashboards.
  • Connect to and transform raw Power BI data into meaningful formats.
  • Create and enhance interactive data visualizations to support business insights.
  • Perform data shaping and combining using Power Query Editor.
  • Build logical data models and create relationships using DAX (Data Analysis Expressions).
  • Who Should Take This Course?

    This course is suitable for :

  • Business analysts and data professionals looking to develop reporting and dashboarding skills.
  • Managers and decision-makers who want to gain insights from data.
  • Excel users aiming to transition into data analytics and visualization.
  • Anyone interested in using Power BI to tell compelling data stories and support real-time business decisions.
  • Pre-requisites

    Participants should have :

  • Basic knowledge of Microsoft Excel (especially in handling tables and basic formulas).
  • A general understanding of business data and reporting concepts.
  • No prior Power BI experience is required—this is a beginner-friendly, foundational course.
  • Upon successfully passing the examination for this course, participants will be awarded a certificate, an example of which is shown below.

    Microsoft Power BI (Data Visualization & Analytics) Certificate
    Microsoft Power BI (Data Visualization & Analytics)
    Microsoft Power BI (Data Visualization & Analytics)